Smarter Monitoring - A Continuous Performance Monitoring Approach
This article describes a case study in which the Smarter Monitoring approach that helped reduce the time for initial problem analysis from hours to minutes. The additional information contained in the logs because of the smarter instrumentation also helped reduce performance problem analysis duration. An implementation approach that ingests 500 million log entries or 70 GB per day of data is briefly described.
Note: this article has originally been published on IBM's developerWorks website on 7. September 2016, and is here republished within IBM's publishing guidelines.
Service-oriented and cloud-based architectures are built on the reuse of existing services. What used to be a monolithic application, easily controlled and monitored on possibly a single server, is now a conglomerate of servers and external services that aren't easy to monitor. Each system or service might have its own log files, possibly on multiple servers, in different formats. Identifying the logs for a client who reported an error is difficult when you have to search so many files. Collecting logs into a common centralized logging infrastructure to allow quick access to all relevant logs should be commonplace. Using a correlation ID to track single requests through your system is an available technique, but is not common. However, the correlation ID helps a great deal analyzing error conditions and performance problems.
In the Smarter Monitoring approach, we added further aspects that helped us analyze and address performance issues:
- Contextualizing the correlation ID
- Parametrized performance measurements
- Resource allocation measurements
- "Always-on" monitoring, in every deployment, in every environment
- A performance engineering role that feeds back improvements into development
The following sections describe the general approach for Smarter Monitoring. An implementation approach using a "classical" architecture (a JEE application with a relational database, for example), that processes up to 500 million log entries a day is also described.
The Smarter Monitoring Approach
The Smarter Monitoring approach consists of technical and operational aspects. As base facilities, all logs are collected into a database or data store. A correlation ID in each log entry allows correlating log entries for each request. Parametrized stopwatch logs provide relevant performance information. In the operational processes, a performance engineer uses these facilities to measure various performance characteristics. The insights are then fed into the development.
Base: Collecting all logs
Today's applications should collect all logs into a common central logging infrastructure. An application that requires your operations team to manually search log files is outdated and wastes your team's efforts.
A modern solution allows you to search and browse logs without having to copy files from (possibly multiple) servers and multiple computing centers, possibly even across shared drives so the support team can access it. Instead, the UI allows you to query and filtering the logs as needed, so you can access the log information quickly.
Contextualized correlation ID
Contextualized correlation ID Accessing logs is one aspect, but finding the right information is even more important. A correlation ID that allows tracking each single request through the system is the first step. The correlation ID is usually created on the client or on the server. It is then put into every originating log statement. Passing the correlation ID to other services allows correlating logs from these services with the request as well.
A correlation ID is only a first step. Putting the ID — and the request — into context allows a smarter logging approach. Context information can be:
- Use case number, service, operation name, or layer where the request enters the system
- Channel where the request enters the system where relevant, for example, Batch, EJB, or a Web Services call
- User ID for the request
- Tenant, where applicable
Some of the context cannot be changed, but other parts can, depending on your requirements. For example, a tenant can be immutable in one system, but if your system is set up so tenants can communicate with each other, a request could change its tenant context.
Tracking a request through the system and services with the correlation ID already enables qualitative analysis of execution paths for a request. Seeing log statements for a single request can be an eye-opener, especially when you find loops with many iterations across expensive operations where you didn't expect them. Usually you will find that the data constellations in a productive system are not what you expected, causing long-running requests and thus performance problems. Context information of the correlation ID becomes even more important when used with performance measurements, as described next.
Parameterized performance measurements
Logs are usually used to write out information about what is happening in the system at a certain point in time. Most of the time, this is done with manually coded log statements. Our approach adds stopwatch logs, which are automatically generated log statements that describe when the request entered a specific section of code and how long it took to execute this section. In this regard, automatically generated means that the stopwatch logs are written in aspects injected into the actual code. This can be done in interceptors around EJB calls, for example, and the programmer doesn't even need to think about this.
In addition to the plain stopwatch logs, you can add parameters to the log entry. This allows, for example, correlating execution time with the number of processed items in a request. The result is the analysis of the scaling behavior of the system.
Combining the stopwatch logs with the context added creates a powerful analysis tool for performance problems. This is also useful in analyzing functional problems.
Performance statistics
Stopwatch logs are written all the time. Because of this, you can generate statistics for each one's measurement point. Resulting statistics include:
- Means
- Derivation
- Min and max values over time
You can analyze the efficiency of an algorithm when you use percentile analysis. For example: In our application, we have a large number of batch jobs running in parallel every night to import documents. Figure 1 shows the measurement of the execution time of these batch jobs (as they run in the background, the execution time can be measured in minutes). The maximum has a sharp limit at five minutes. This means batch jobs run into a transaction timeout limit and should be adjusted.
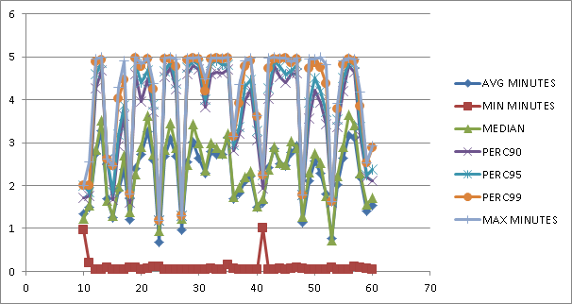
Percentile analysis helps identify outliers, where all percentiles are essentially a flat line with peaks for the maximum value. These outliers have often shown to be caused by infrastructure hiccups, often related to large write operations (BLOBs, for example) in the database, or accessing the storage subsystem. This might be an indicator that the storage subsystem is not providing the necessary service level as agreed (if such an agreement exists).
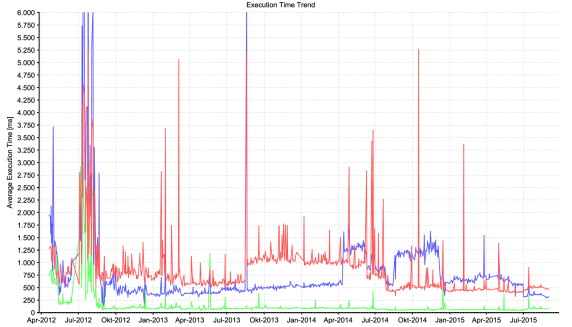
If aggregated values are retained, you can perform statistical analysis across longer time scales, as shown in the figure below, which shows the mean execution time of three functions over three years of production. Beginning with some performance improvements, we see some steps up in the red curve during the August and December 2013 releases until finally, the optimization approaches work in July 2014 and the August 2014 release. At the same time, we had to optimize the function behind the blue curve. Outliers indicate other problems, usually with the infrastructure.
Measuring scaling behaviour
It is often a surprise what people do with a system after they roll it out. End users often don't fully understand the type and size of data constellations (number of items in a shopping cart or the number of documents in a case folder in a DMS, for example). It is possible to measure the scaling behavior of a system (how a system behaves under such changing data constellations) when you use additional parameter(s) in performance management. This allows, on one side, identifying why some requests take longer than others; but it also allows predicting, to a certain degree, the behavior of the system in advance for larger data sizes.
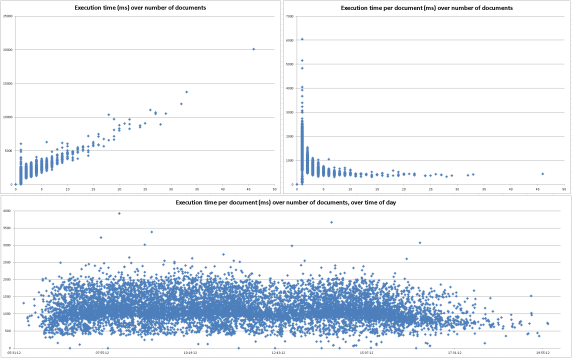
Figure 3 shows a sample analysis from a live system. The top-left diagram shows raw execution times drawn over the parameter. In this case, this is the number of documents processed in this specific interaction. The top right shows the same data, but each execution time is divided by the number of documents processed. What this shows is a constant time offset and a part that increases linearly with the number of processed documents. This lets you predict how long the interaction can take with larger data sets.
The bottom diagram shows the same data as the top-right diagram, but spread out over the time of day. This allows correlating execution times with other load situations. Note that there are two types of interactions (most likely depending on some functional requirements) that each take a different amount of time. One type seems to be able to run at 500 ms per document; the other seems to take at least about 800 ms.
Resource allocation measurements
Not just having a point in time where a request occurred but its concrete duration enables detailed resource allocation measurements. You can overlap the duration of all running requests at a point in time and determine how many requests there are in your system. It is often unclear how many users are on the system. Estimations are done during the requirements engineering, but in the end, it is difficult to predict. Design changes during development change the number of server calls per interaction, and so on. The Smarter Monitoring approach allows you to easily measure the degree of parallelism.
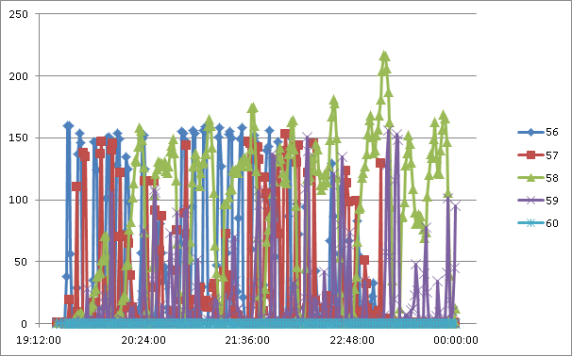
Figure 4 shows an example of this in a batch framework (the numbers 56, 57-60 are batch type indicators). The problem was that the batch framework could be configured for a degree of parallelism. Only with the Smarter Monitoring measurements were we able to see if we achieved this degree of parallelism. In fact, we identified configuration issues in the application server that prevented the system from achieving the configured degree of parallelism. In one case, it was a configuration for threads per JEE application, and in another, it was a setting for the application server's workload balancing.
Other types of analysis include:
- Time of flight analysis — How long does it take for a message in an asynchronous system to be received, and are there signs of resource starvation, such as unexpected wait times?
- Workload analysis — Is the workload distributed equally across your servers (or at least the way you designed it)?
- Network latency analysis — If you have stopwatch logs when the request exits one system and another stopwatch log when the same request (correlation ID) enters the other system, you can measure network latency between the systems.
Always-on performance engineering
Performance analysis tools are often separate from the application. This means in the case of a performance problem, the tool needs to be set up, possibly in a test environment, separate from the production environment. Then the problem has to be recreated, which is often not successful.
An important aspect of the Smarter Monitoring solution is that it is always on. It is an integrated part of the system. Even in our development environment, a developer can enable the log server that collects the log statements. This is because each deployment contains the logging and monitoring infrastructure. A working Smarter Monitoring solution is a quality gate for the deployment. You can analyze the logs for each deployment and in every environment.
An important aspect of Smarter Monitoring is that there is no need for separate activities to enable it to recreate and analyze problems. Each deployment trains the deployment team to do the necessary steps, so deployment errors and broken deployments can be avoided.
In our project, the development and test teams use the Smarter Monitoring approach to analyze performance and functional problems. It is an invaluable tool for the quality management process.
Performance Architect role
“ Smarter Monitoring is an invaluable tool because it is "always on." The problem analysis effort has dropped dramatically. ”
Because the solution is available in every environment, it can easily be used to investigate problems in every stage of development. The performance architect is a project role we created to investigate performance problems. The performance architect not only looks at performance problems in production but also at load tests, and supports and gives advice to development teams about performance optimization. It's mandatory that the performance architect is involved in the project or in change requests before the actual design and development. Because of this early involvement, they can identify performance-critical changes or use cases from the information gathered from the parametrized performance logs. This way, performance risks are identified early and mitigated quickly and efficiently.
Implementation considerations
The implementation of a Smarter Monitoring solution can be based on different types of technology. In fact, the solution is technology-agnostic. There are, however, considerations necessary for any implementation.
Data size implications
Storing the amount of logs produced by a Smarter Monitoring solution can be challenging. In our current implementation, we write up to 500 million performance log entries per day, with higher throughput at peak times. There are some requirements:
- The storage subsystem must be capable of writing the amount of data in the necessary time frame.
- The log database or storage — relational or NoSQL — must be capable of managing this amount of data.
- The storage system must be able to store the amount of data.
- Old data must be aggregated in time, and deleted when necessary.
Asynchronous logging
Writing log files in a standard logging framework is often performed in a synchronous way. Synchronous log writing makes the application susceptible to throughput problems in the logging and monitoring infrastructure.
So instead of writing the logs synchronously, the log entries should be collected into a batch and written asynchronously. To mitigate performance problems in the logging infrastructure itself, less- important log entries can be discarded to ensure that the application itself does not slow down.
In our application, log entries are handed over to a specific log appender (in log4 terminology) that collects them into a batch of log entries, then asynchronously transfers them to log storage in a single request. The appender buffers a certain amount of logs in memory. When it notices that the number of logs rises higher than they can be written into the database, it drops them and adds a specific log message warning. This way, the situation can be investigated, but the actual production system is not slowed down.
A word of caution
A word of caution When we started working with stopwatch logs, we were excited about what we could measure and learn about the system. So we added a lot of stopwatch logs. We added so many that the logging started to overwhelm our logging infrastructure and slow the application. So we learned to keep the stopwatch entries (mostly) limited to the crossing of component boundaries. This ensures that the component responsible for a performance problem can be identified. Essential stopwatch logs are where a request enters or exits the system. Still, stopwatch logs use about 10 times the amount of space than the usual logs that still exist.
It is tempting to drill down too much to understand the system, even if there is no actual problem. Make sure you concentrate on real problems. For example, in the system where these images come from, there is a single interaction that is not linear, but gets exponentially slower with larger data sets. However, the interaction itself is fast (up to 100 ms), and the data set size is estimated to be limited. As tempting as it is to investigate and fix the algorithm, for now, it is not worth the effort.
Case study - A large DMS project
This case study shows the chosen implementation approach.
A large public sector client in Germany implemented the Smarter Monitoring solution in an electronic document management system (DMS) project. The solution helped to fulfill and keep the performance requirements, even during the necessary performance improvements for the document import. Because of new requirements, the number of documents to import each night had to increase five times over. System analysis with Smarter Monitoring helped achieve this goal.
To allow immediate analysis and feedback for any performance — and often even other functional — problems, it was important that the Smarter Monitoring infrastructure was part of the standard deployment and available across all environments.
The solution
The following figure shows the original solution.
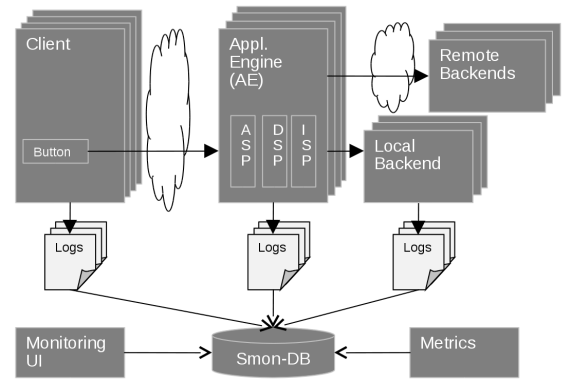
Each user interaction with the system creates a unique correlation ID that passes through the system with the request. Logs from the client, more than 100 application engine servers, and local back-end servers, are collected into a relational database. Only when the user voluntarily accepts the data privacy terms and conditions, the Java-based client uploads its log to the server. The server logs are written via a log4j log server, which then asynchronously writes it to a relational database.
Metrics collected through a JMX client extend the performance data with information about infrastructure health. A monitoring UI then allows querying and analyzing the performance data.
Each log entry contains infrastructure information, such as originating server name or logger name. The log entry also contains context information, including tenant, request source, and user ID.
The UI allows exporting the logs filtered — by correlation ID, for example, so specifically filtered logs can be given from the operations team to the development team for further analysis and investigation. With this approach, we can log about 70 GB of data in up to 500 million log entries per day into the logging database.
Some architectural decisions we might revisit in future Smarter Monitoring applications include:
- Use of log servers that decouple the application from the actual writing of the logs. Maybe the appender can directly integrate into the application server's log infrastructure.
- Use of JDBC appenders in the log servers. In a cloud environment, an HTTPS uploader might be more practical.
- A standard relational database was used because of the available skillset and tooling. Neither a NoSQL database nor an in-memory database was available at the time.
The technology decision needs to be made carefully because the required infrastructure can vary greatly depending on the tooling used. While we have a single large database, another NoSQL solution presented in "How do you scale a logging infrastructure to accept a billion messages a day?" requires a large number of servers solely to monitor only twice the amount of logs compared to our solution.
Conclusion
The Smarter Monitoring approach is a valuable technology-independent performance monitoring approach. It combines many features in a unique way:
- A correlation ID tracks requests through the system, including microservices.
- Logs from various services are collected and aggregated into a central log database.
- Context-aware and parametrized performance logs allow detailed performance analysis and investigation of scaling behavior.
- Parallelization measurements allow tracking resource usage.
- It delivers full performance metrics from the start, in test, and in production.
- A performance engineering role feeds back insights to the development team.
Our first implementation uses a JEE environment with relational databases on an Intel architecture distributed environment, but you can implement it in other environments, such as System p® or System z®.
Using this combined approach, projects continually meet their performance and scalability requirements, which is essential with today's faster development cycles.